Unraveling Gravitational waves with LIGO data
In 1916 the great mind of Albert Einstein predicted a phenomenon called Gravitational waves based on his masterpiece, The General theory of Relativity. Yet the technology wasn’t complex enough to prove any evidence of gravitational waves until 2016. Thanks to Nobel prize winning trio and their teams at LIGO, The Laser Interferometer Gravitational-Wave Observatory humans finally discovered the first evidence of gravitational waves.
What is gravitational wave?
Imagine you are standing on a rubber sheet, your weight will cause that rubber sheet to bend. Similarly, according to the theory of relativity the masses of objects create a distortion in the space around it. When there’s another object try to move in a straight line it will however going around that in an orbit because of that. It’s not actually a force pulling that object but the bending of the space. So, how does gravitational waves produce?.
It’s when these masses accelerate changing the distortion of the space will create these ripples of space and time. Theoretically everything with mass and energy can produce gravitational waves. for example two dancers doing a couple dance can produce gravitational waves BUT they are practically undetectable because gravity is an extremely weak force compared to other forces in the universe therefore it needs extremely massive very very fast moving objects to produce ripples which can be detectable, like the final moments of two black holes merging together.
How on earth are we going to find them?
If the space between us and the object stretch or compressed even the “marks” that have in the fabric of space will get stretched or compressed too. However, there’s one solution, light, if the space get stretched lights needs more time to reach and if the space get compressed light needs less time to travel the distance since it’s a constant and that’s basis of LIGO.
They have opened many of their datasets including the GW150914, first ever GW observed by human kind, on LIGO Open Science Centre.
The data plays a vital role in finding GWs because the effect of these ripples are so minuscule which can be confused with random noise so, scientists need a novel data analysis methods to unravel this mystery. It’s like trying to match a particular humming sound in a very very noisy room.
Let’s have a look at the GW150914.
LIGO has open the data in 3 formats. hd5, gwf and gzipped ascii text. gwf is a common data frame format for interferometric gravitational wave detectors and we will use this format for further analysis because there’s a great python library which supports this format called Pycbc (this post is just a quick look at the data and it’s results. I will write another post on Pycbc and the way to generate this results in depth later) This event was detected in data from two observatories, LIGO Hanford and LIGO Livingston.
# Download the data.
curl -O -J https://losc.ligo.org/s/events/GW150914/H-H1_LOSC_4_V2-1126259446-32.gwf
curl -O -J https://losc.ligo.org/s/events/GW150914/L-L1_LOSC_4_V2-1126259446-32.gwf
Next see the the data in a time series.
from pycbc.frame import read_frame
from pycbc.filter import highpass_fir, lowpass_fir
from pycbc.psd import welch, interpolate
import pylab
for ifo in ['H1', 'L1']:
    # Read data: The data is available to the public through losc.ligo.org!
    fname = '%s-%s_LOSC_4_V2-1126259446-32.gwf' % (ifo[0], ifo)
    ts = read_frame(fname, '%s:LOSC-STRAIN' % ifo)

    # Estimate the noise spectrum and use it to whiten the data
    psd = interpolate(welch(ts), 1.0 / ts.duration)
    white_strain = (ts.to_frequencyseries() / psd ** 0.5).to_timeseries()
# remove frequencies below and above where the main portion of the signal lies
    smooth = highpass_fir(white_strain, 35, 8)
    smooth = lowpass_fir(smooth, 300, 8)
# time shift and flip L1 to match the time of arrival and phase of Hanford
    if ifo == 'L1':
        smooth *= -1
        smooth.roll(int(.007 / smooth.delta_t))
pylab.plot(smooth.sample_times.numpy(), smooth.numpy(), label=ifo)
# Plot the region around the signal (time is in gps seconds)
pylab.legend()
pylab.xlim(1126259462.26, 1126259462.48)
pylab.ylabel('Smoothed-Whitened Strain')
pylab.grid()
pylab.ylim(-100, 100)
pylab.xlabel('GPS Time (s)')
pylab.show()
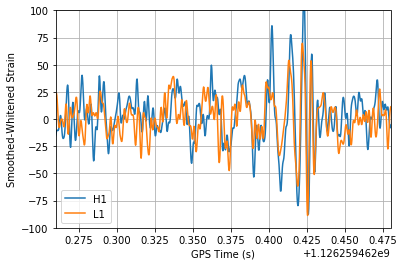
And here comes the most interesting part, converting the the merger of a black hole of 33 solar mass with a similar size neutrino star billions of light years away in other words happened billions of years ago.
from pycbc.frame import read_frame
from pycbc.filter import highpass_fir, lowpass_fir
from pycbc.psd import welch, interpolate
from pycbc.types import TimeSeries
# Read data and remove low frequency content
fname = 'H-H1_LOSC_4_V2-1126259446-32.gwf'
h1 = highpass_fir(read_frame(fname, 'H1:LOSC-STRAIN'), 15.0, 8)
# estimate the noise spectrum and whiten
psd = interpolate(welch(h1), 1.0 / 32)
white_strain = (h1.to_frequencyseries() / psd ** 0.5 * psd.delta_f).to_timeseries()
# remove some of the high and low frequencies
smooth = highpass_fir(white_strain, 25, 8)
smooth = lowpass_fir(white_strain, 250, 8)
# slow the data down by a factor of 4
smooth = TimeSeries(smooth, delta_t=smooth.delta_t*4)
#strech out and shift the frequency upwards by 300 Hz to aid human hearing
frequency_shift = 300.0
fdata = smooth.to_frequencyseries()
fdata.roll(int(frequency_shift / fdata.delta_f))
smooth = fdata.to_timeseries()
#Take slice around signal
smooth = smooth[len(smooth)/2 - 1500:len(smooth)/2 + 3000]
smooth.save_to_wav('gw150914_h1_chirp.wav')
You can listen to it from here
However, Gravitational waves are not sound. They travel at the speed of light, not speed of sound. Similar to how redios convert radio waves to it’s sound final chirp of the merger can be reconstructed with gravitational waves.
You can listen to it from here
This finding has begun a new chapter in physics with a new branch of study the novel data analytics techniques with tons of data in the future with new observatories will soon produce some more amazing and surprising results.