Listening to Hydrogen
In a previous post I was able to get an “audible” gravitational wave even though gravitational waves are not sound waves. I learnt that this process of mapping non audio data and interpreting them in an auditory manner is called sonification. So, I thought of sonifying hydrogen and see the outcome.
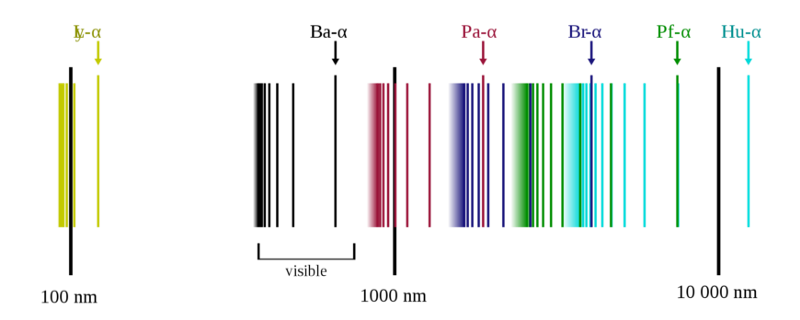
The emission spectrum of atomic hydrogen is divided into a number of spectral series, with wavelengths given by the Rydberg formula. These observed spectral lines are due to the electron making transitions between two energy levels in an atom. Let’s try to Sonify one of these spectral series, before that let’s understand the Rydberg formula for hydrogen.
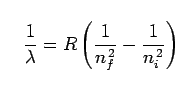 Here λ is the wavelength that we are going to calculate, R is the Rydberg constant. nf < ni where this emission spectrum of hydrogen is quantized in other words a hydrogen atom can only emit photons with certain fixed set of wavelengths. Likewise, a hydrogen atom can only absorb photons which have the same fixed set of wavelengths. enough let’s see that in action!!
import IPython
import numpy as np
import scipy
from matplotlib.pyplot import plot
from numpy import sin, pi
## some consstant for our audio file
rate = 44100 #44.1 khz
duration =2.5 # in sec
# this will give us sin with the righ amplitude to use with wav files
normedsin = lambda f,t : 2**13*sin(2*pi*f*t)
time = np.linspace(0,duration, num=rate*duration)
fshift = 440
ryd = lambda n,m : 440*(1/(n**2) -1/(m**2))
flyman = lambda x : ryd(1,x)
fbalmer = lambda x : ryd(2,x)
## define the sum,
ser = lambda t : sum( [normedsin(flyman(i),t)+normedsin(fbalmer(i+1),t) for i in range(2,8)])
serv = scipy.vectorize(ser)
ss = serv(time)
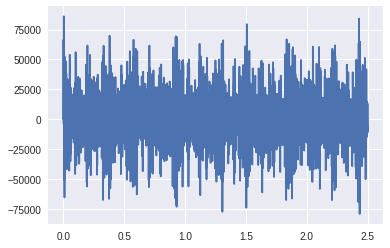
plot(time,ss)
ss = 2**15*ss/ ss.max()
IPython.display.Audio(ss.astype(np.int16), rate=rate)
Have fun!